Hey there, fellow AI enthusiast! Ever wondered how Netflix knows exactly what movie to recommend, or how your email magically filters out spam? Well, you're about to embark on an exciting journey into the world of machine learning algorithms. Don't worry if you're new to this – we're going to break it down in a way that's easy to understand and, dare I say, fun!Let's Start with a Story
Imagine you're trying to teach your dog a new trick. You give them a treat when they do it right and maybe a gentle "no" when they don't quite get it. Over time, your furry friend learns the trick. Believe it or not, this is a lot like how machine learning works! We're just teaching computers instead of dogs, and we use data instead of treats. Cool, right?Now, let's dive into the top 10 machine learning algorithms that are like the Swiss Army knives of the AI world. Each one has its own superpower, and by the end of this guide, you'll have a solid grasp of when and how to use them.Let's embark on this journey through the top 10 machine learning algorithms, understanding their basic principles, and exploring their real-world applications.1. Linear Regression: Predicting Continuous Outcomes
What is Linear Regression?
Linear regression is one of the simplest yet most powerful algorithms in machine learning. It's used to predict a continuous outcome based on one or more input variables. Think of it as finding the best-fitting straight line through a set of data points .How Does It Work?
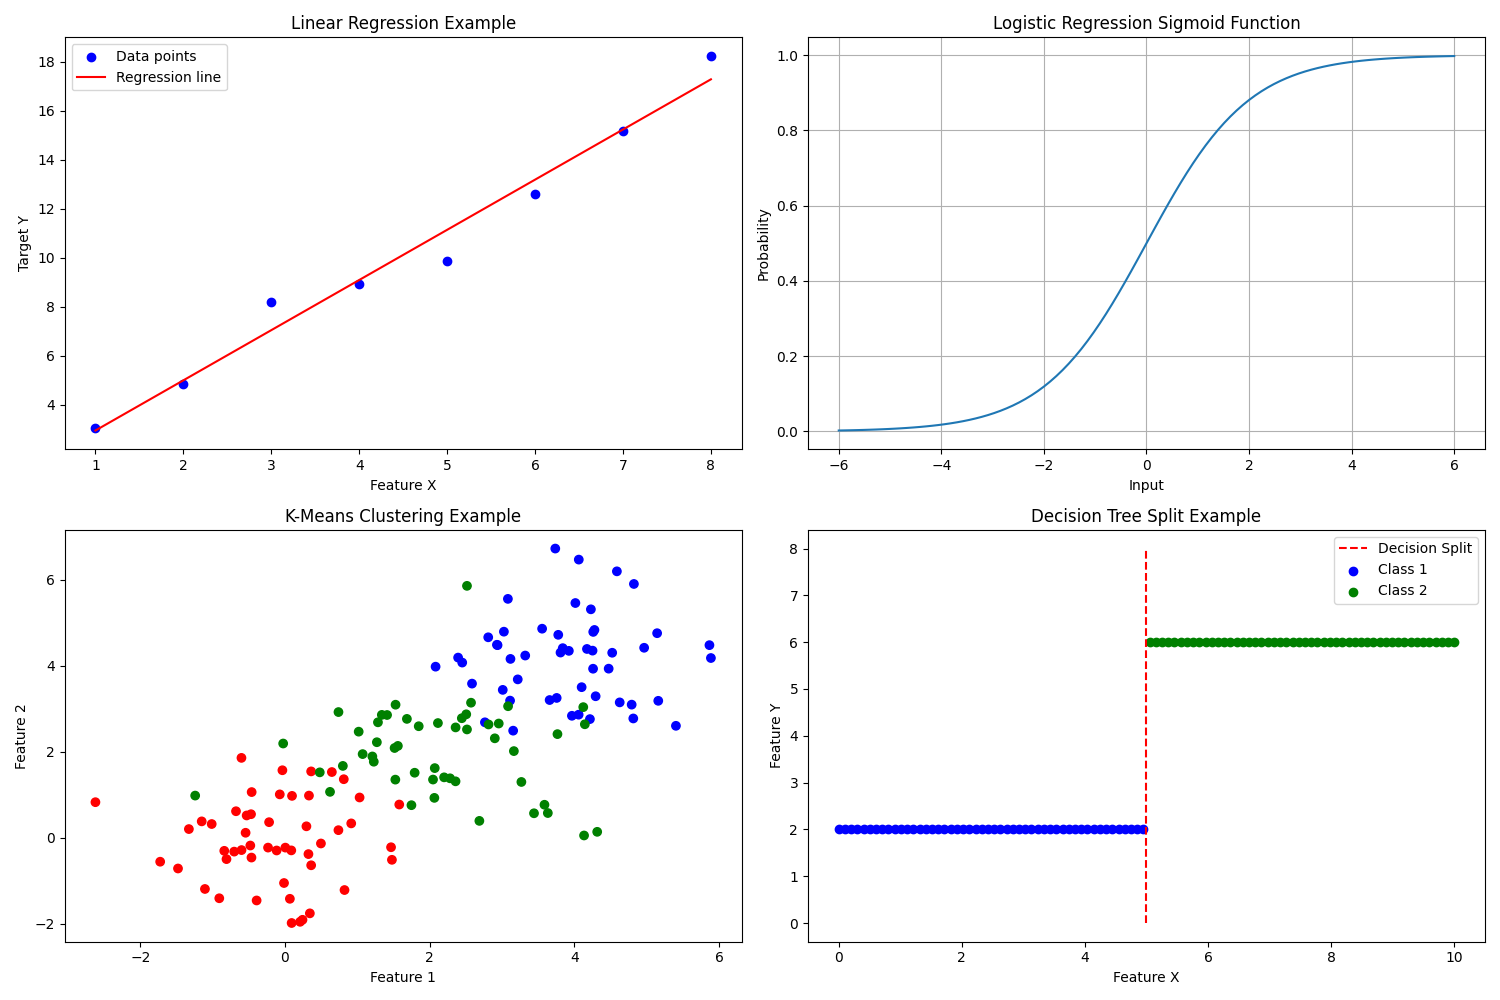
Imagine you're trying to predict house prices based on their size. Linear regression would find the line that best represents the relationship between house size and price. This line can then be used to estimate prices for new houses.In the top-left graph of the image, we can see a visual representation of linear regression. The blue dots represent individual data points (e.g., house sizes and their corresponding prices), while the red line shows the best-fitting linear relationship between these points.Real-World Applications
- Finance: Predicting stock prices based on historical data and market indicators .
- Real Estate: Estimating property values based on features like location, size, and age.
- Healthcare: Forecasting patient health metrics such as blood pressure or cholesterol levels based on lifestyle factors and genetic markers.
Linear regression's simplicity and interpretability make it a great starting point for many predictive modeling tasks.2. Logistic Regression: Binary Classification Made Simple
Understanding Logistic Regression
Despite its name, logistic regression is primarily used for classification problems, particularly binary classification. It estimates the probability that a given input belongs to a particular category .The Mechanics Behind Logistic Regression
Logistic regression uses a logistic function (also known as a sigmoid function) to map predicted values to probabilities between 0 and 1. This makes it ideal for yes/no or true/false predictions.In the top-right graph of our image, we can see the characteristic S-shaped curve of the logistic function. This curve represents how the probability of an outcome changes as the input value increases.Practical Examples
- Email Filtering: Determining whether an email is spam or not based on its content and metadata.
- Healthcare: Predicting the likelihood of a patient having a particular disease based on symptoms and test results.
- Finance: Assessing credit risk by estimating the probability of a borrower defaulting on a loan.
Logistic regression's ability to provide probabilities makes it valuable in scenarios where understanding the likelihood of an outcome is as important as the classification itself.3. Decision Trees: Mapping Choices and Outcomes
The Concept of Decision Trees
Decision trees are versatile algorithms used for both classification and regression tasks. They work by splitting the data into subsets based on the values of input features, creating a tree-like model of decisions .How Decision Trees Make Decisions
Imagine a flowchart where each node represents a decision based on a feature, and each branch represents the outcome of that decision. This process continues until a final decision (leaf node) is reached.The bottom-right graph in our image illustrates a simple decision tree split. The red dashed line represents a decision boundary, separating two classes (blue and green points) based on a single feature.Real-World Applications
- Healthcare: Diagnosing medical conditions by analyzing patient symptoms and test results.
- Finance: Detecting fraudulent transactions by identifying patterns in transaction data.
- Customer Service: Creating automated troubleshooting guides for customer support.
Decision trees are particularly useful when you need to make decisions based on multiple criteria and want a clear, interpretable model.4. Random Forests: Harnessing the Power of Many Trees
What Are Random Forests?
Random forests take the concept of decision trees to the next level. They are an ensemble learning method that combines multiple decision trees to improve accuracy and control overfitting .The Forest for the Trees
In a random forest, each tree is trained on a random subset of the data and features. The final prediction is made by averaging the predictions of all trees (for regression) or taking a majority vote (for classification).Practical Applications
- Finance: Predicting stock market trends and assessing investment risks.
- Healthcare: Identifying important genetic markers for diseases .
- E-commerce: Predicting customer purchase behavior and optimizing inventory management.
Random forests excel in handling complex datasets with many features, making them a go-to choice for many data scientists.5. Support Vector Machines (SVM): Finding the Perfect Boundary
The SVM Approach
Support Vector Machines are powerful algorithms used for classification and regression tasks. They work by finding the hyperplane that best separates different classes of data points .How SVMs Separate Data
Imagine you have two types of data points on a plane, and you need to draw a line to separate them. SVM finds the line (or hyperplane in higher dimensions) that maximizes the margin between the classes, making it robust to outliers.Real-World Use Cases
- Image Classification: Distinguishing between different objects or scenes in images.
- Text Categorization: Classifying documents into predefined categories based on their content.
- Bioinformatics: Analyzing genetic data to predict protein functions.
SVMs are particularly effective in high-dimensional spaces and cases where the number of dimensions is greater than the number of samples.6. K-Nearest Neighbors (KNN): Classification by Proximity
Understanding KNN
K-Nearest Neighbors is an instance-based learning algorithm used for both classification and regression. It classifies a data point based on how its neighbors are classified .The KNN Process
To classify a new data point, KNN looks at the 'k' nearest data points in the training set and assigns the most common class among them. The value of 'k' is a hyperparameter that you can adjust.Practical Examples
- Recommendation Systems: Suggesting products to customers based on similar users' preferences.
- Image Recognition: Classifying images based on pixel similarity to known images.
- Healthcare: Predicting disease outbreaks by analyzing geographical and temporal data .
KNN's simplicity and effectiveness make it a great algorithm for understanding the basics of classification and regression tasks.7. Naive Bayes: Probabilistic Learning
The Naive Bayes Approach
Naive Bayes is a probabilistic classifier based on Bayes' theorem. It's called "naive" because it assumes independence between features, which is often not the case in real-world scenarios .How Naive Bayes Works
Naive Bayes calculates the probability of a data point belonging to each class and then selects the class with the highest probability. Despite its simplifying assumption, it often performs well, especially in text classification tasks.Real-World Applications
- Spam Detection: Classifying emails as spam or not spam based on the frequency of certain words.
- Sentiment Analysis: Determining the sentiment (positive, negative, neutral) of customer reviews or social media posts.
- Medical Diagnosis: Predicting the likelihood of diseases based on patient symptoms.
Naive Bayes is particularly useful when you need a fast, scalable algorithm for large datasets, especially in text classification problems.8. K-Means Clustering: Grouping Similar Data
Understanding K-Means
K-Means is an unsupervised learning algorithm used to partition data into 'k' clusters based on feature similarity. It's widely used for data segmentation and pattern recognition.The K-Means Process
The algorithm works by iteratively assigning data points to the nearest cluster center and then recalculating the center based on the assigned points. This process continues until the cluster assignments stabilize.In the bottom-left graph of our image, we can see an example of K-Means clustering. The data points are grouped into three distinct clusters (red, blue, and green), illustrating how K-Means can identify natural groupings in data.Practical Use Cases
- Customer Segmentation: Grouping customers with similar purchasing behaviors for targeted marketing.
- Image Compression: Reducing the number of colors in an image by clustering similar colors.
- Anomaly Detection: Identifying unusual data points that don't fit into any cluster.
K-Means is particularly useful when you need to discover inherent groupings in data without predefined categories.9. Gradient Boosting Machines (GBM): Boosting Performance
The Power of Gradient Boosting
Gradient Boosting Machines are an ensemble technique that builds models sequentially, with each new model correcting errors made by the previous ones .How GBM Works
GBM starts with a simple model and iteratively adds new models to correct the errors of the previous ensemble. This process continues until the model reaches a desired level of performance or a maximum number of iterations.Real-World Applications
- Finance: Credit scoring and risk assessment in lending decisions.
- Healthcare: Predicting patient outcomes based on historical data and treatment plans.
- Marketing: Optimizing marketing campaigns by predicting customer response rates.
GBM's ability to handle complex relationships in data makes it a powerful tool for a wide range of predictive modeling tasks.10. Neural Networks: Mimicking the Human Brain
Understanding Neural Networks
Neural networks are inspired by the human brain and consist of layers of interconnected nodes (neurons). They excel in tasks where the relationship between input and output is highly non-linear .The Neural Network Process
Data flows through the network, with each neuron performing simple computations. The network learns by adjusting the strengths of connections between neurons based on the errors in its predictions.Practical Examples
- Image and Speech Recognition: Identifying objects in images or transcribing spoken language.
- Natural Language Processing: Language translation and sentiment analysis in text.
- Autonomous Vehicles: Processing sensor data to make real-time driving decisions.
Neural networks, especially deep learning models, have revolutionized fields like computer vision and natural language processing.Conclusion: Choosing the Right Algorithm
Each of these machine learning algorithms has its strengths and is suited for different types of problems. The choice of algorithm depends on factors such as the nature of the data, the size of the dataset, the desired outcome, and the interpretability requirements.As you embark on your machine learning journey, remember that understanding these algorithms is just the beginning. The real power comes from knowing when and how to apply them to solve real-world problems.By mastering these top 10 machine learning algorithms, you'll have a solid foundation to tackle a wide range of data science challenges. Whether you're predicting stock prices, diagnosing diseases, or building recommendation systems, these algorithms will be your trusted tools in the exciting world of machine learning.Keep exploring, experimenting, and learning. The field of machine learning is constantly evolving, and there's always something new to discover!